Data notes / 01 · Electricity · 2025
Who leads Europe in solar? First, choose a denominator.
A small electricity system can top the share ranking while producing relatively little solar power. The 2025 data show why both measures matter.
Studio 1729 · · Sources retrieved 6 November 2026
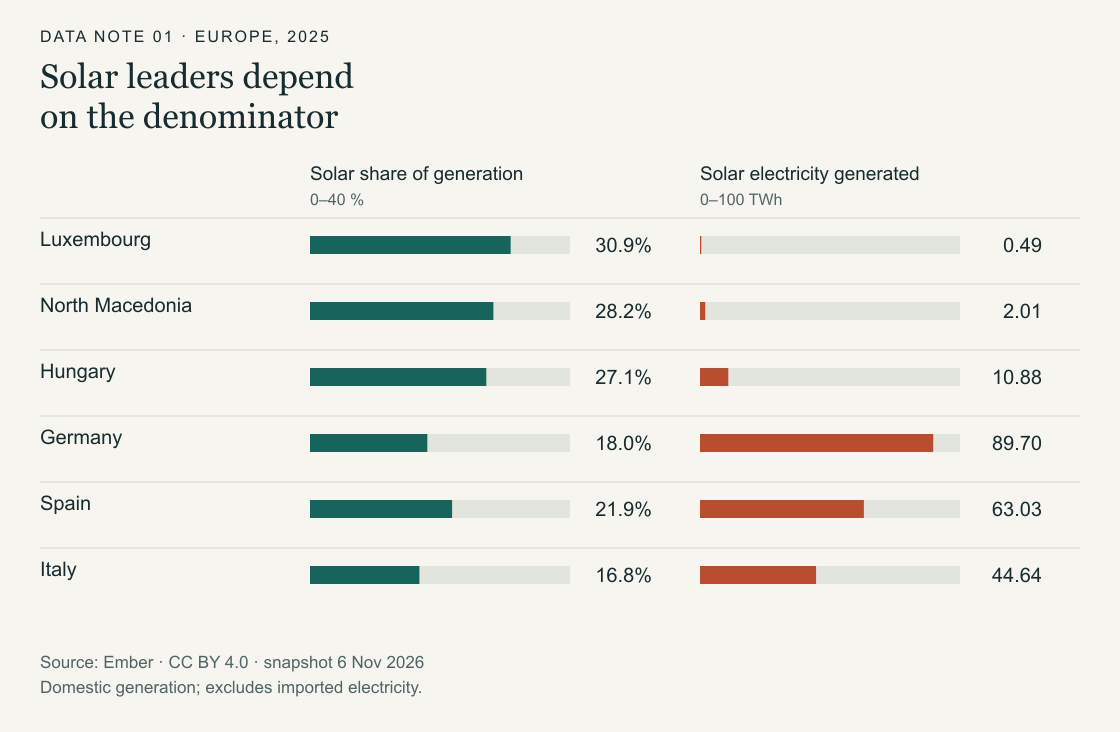
Luxembourg has the highest solar share in this European comparison for 2025: 30.9% of domestic electricity generation. Germany produces the most solar electricity: 89.70 terawatt-hours (TWh). These are answers to different questions. A third answer appears if the comparison excludes small solar producers: among countries generating at least 5 TWh from solar, Hungary leads on share, at 27.1%.
The distinction matters when a report calls a country a “solar leader”. A share describes the composition of that country’s electricity generation. A volume describes how much electricity its solar installations generated over the year. A minimum-output filter changes which countries qualify for comparison. None of these measures describes installed capacity, electricity consumption, or solar power available at a particular hour.

Read the data table · 39 rows
| Country | Code | Year | Solar share (%) | Solar (TWh) | Total (TWh) |
|---|---|---|---|---|---|
| Luxembourg | LUX | 2025 | 30.871 | 0.493 | 1.597 |
| North Macedonia | MKD | 2025 | 28.212 | 2.007 | 7.114 |
| Hungary | HUN | 2025 | 27.123 | 10.883 | 40.125 |
| Spain | ESP | 2025 | 21.862 | 63.032 | 288.315 |
| Netherlands | NLD | 2025 | 21.111 | 28.507 | 135.037 |
| Cyprus | CYP | 2025 | 20.556 | 1.187 | 5.774 |
| Greece | GRC | 2025 | 19.645 | 11.38 | 57.928 |
| Estonia | EST | 2025 | 18.944 | 1.163 | 6.139 |
| Lithuania | LTU | 2025 | 18.652 | 1.65 | 8.846 |
| Bulgaria | BGR | 2025 | 18.21 | 6.933 | 38.072 |
| Germany | DEU | 2025 | 18.048 | 89.704 | 497.035 |
| Portugal | PRT | 2025 | 17.32 | 8.854 | 51.119 |
| Italy | ITA | 2025 | 16.833 | 44.641 | 265.199 |
| Malta | MLT | 2025 | 15.935 | 0.355 | 2.228 |
| Belgium | BEL | 2025 | 14.476 | 10.434 | 72.08 |
| Austria | AUT | 2025 | 14.069 | 10.304 | 73.239 |
| Latvia | LVA | 2025 | 13.168 | 0.82 | 6.227 |
| Denmark | DNK | 2025 | 12.813 | 4.563 | 35.613 |
| Switzerland | CHE | 2025 | 12.123 | 7.883 | 65.023 |
| Poland | POL | 2025 | 11.313 | 19.543 | 172.748 |
| Slovenia | SVN | 2025 | 10.133 | 1.505 | 14.852 |
| Romania | ROU | 2025 | 9.961 | 4.96 | 49.793 |
| Croatia | HRV | 2025 | 8.924 | 1.314 | 14.724 |
| Moldova | MDA | 2025 | 7.818 | 0.228 | 2.916 |
| United Kingdom | GBR | 2025 | 6.606 | 19.399 | 293.659 |
| Czechia | CZE | 2025 | 5.815 | 4.392 | 75.526 |
| France | FRA | 2025 | 5.574 | 32.013 | 574.372 |
| Ireland | IRL | 2025 | 4.614 | 1.458 | 31.601 |
| Bosnia Herzegovina | BIH | 2025 | 4.018 | 0.584 | 14.535 |
| Montenegro | MNE | 2025 | 3.128 | 0.076 | 2.43 |
| Sweden | SWE | 2025 | 2.61 | 4.444 | 170.246 |
| Slovakia | SVK | 2025 | 2.462 | 0.716 | 29.084 |
| Finland | FIN | 2025 | 1.186 | 0.978 | 82.483 |
| Serbia | SRB | 2025 | 0.961 | 0.348 | 36.229 |
| Belarus | BLR | 2025 | 0.341 | 0.155 | 45.429 |
| Norway | NOR | 2025 | 0.334 | 0.537 | 160.855 |
| Russia | RUS | 2025 | 0.239 | 2.858 | 1194.437 |
| Kosovo | XKX | 2025 | 0.171 | 0.01 | 5.864 |
| Iceland | ISL | 2025 | 0.055 | 0.01 | 18.266 |
What happens when small producers are included?
Luxembourg generated 0.493 TWh from solar out of 1.597 TWh in total. North Macedonia generated 2.007 TWh from solar out of 7.114 TWh, giving it a 28.2% solar share. Hungary generated 10.883 TWh from solar out of 40.125 TWh. In this snapshot, those are the three highest shares among the 39 European countries with 2025 observations.
Apply a minimum of 1 TWh of solar generation and Luxembourg drops out; North Macedonia becomes the share leader. Raise that threshold to 5 TWh and North Macedonia also drops out, leaving Hungary first. The values have not changed. The population being ranked has. A threshold can make a comparison more relevant to a specific question, but it needs to be visible beside the ranking.
This is especially relevant when comparing a chart of large producers with a table covering every available country. A country missing from the chart has not necessarily performed worse. It may simply fall below its inclusion threshold. A geographical restriction also changes the comparison: North Macedonia is included in this Europe dataset, while a ranking restricted to EU members has a different set of candidates.
The output ranking tells another story
Germany, Spain and Italy are the largest solar generators in this sample, producing 89.704, 63.032 and 44.641 TWh respectively. Germany’s solar share is 18.0%, below all three share leaders in the figure. Its much larger total electricity output means that a smaller percentage still represents a much larger quantity of solar generation.
Germany produced about 182 times as much solar electricity as Luxembourg in 2025, despite having a solar share around 13 percentage points lower. That ratio is calculated from their reported solar output, not their total generation. It is a comparison of annual production volumes; it says nothing by itself about population, land area, investment efficiency or the amount of solar capacity installed.
A generation share is not a consumption share
The denominator here is electricity generated inside each country. Imported electricity is not included. A high solar share of domestic production therefore does not establish that the same share of electricity used by households and businesses came from domestic solar. Answering that question would require a consumption-based treatment of trade, including decisions about how to attribute imported electricity to sources.
Annual shares also conceal timing. The figures do not show midday production, seasonal variation, storage, curtailment or demand at the time electricity was generated. They cannot establish how much firm supply a country has. For a report about annual generation, they provide a clear comparison; for a report about adequacy or hourly matching, a different dataset is needed.
Scope, source and reuse
This note uses Ember’s Yearly Electricity Data, retrieved on 6 November 2026. The geographic scope follows Ember’s Europe group, including Cyprus and Russia and excluding Türkiye. Of 42 countries and economies in the local series, 39 have 2025 generation data. Albania, the Faroe Islands and Ukraine are omitted from the ranking because their latest available observations are earlier. Missing years are not replaced with earlier values.
The figure selects the top three countries by solar share and the top three by solar output. The downloadable table contains all 39 observations. Shares are Ember’s published values; display labels are rounded, while the CSV keeps source precision. These are a dated snapshot, and subsequent source revisions may change the ordering. Data: Ember, CC BY 4.0; selection and calculations by Studio 1729.
Made by Studio 1729. We build pieces like this for reports: sprint.1729.studio.