 STUDIO 1729
Give your research
another way in.
I turn your data into an interactive map or comparison that readers can explore. For energy and climate researchers, NGOs, consultancies and newsrooms.
Where Europe’s
electricity came from.
Change the year. Switch the source. Compare countries. A small example of what an interactive companion can add to a report.
Open the electricity atlas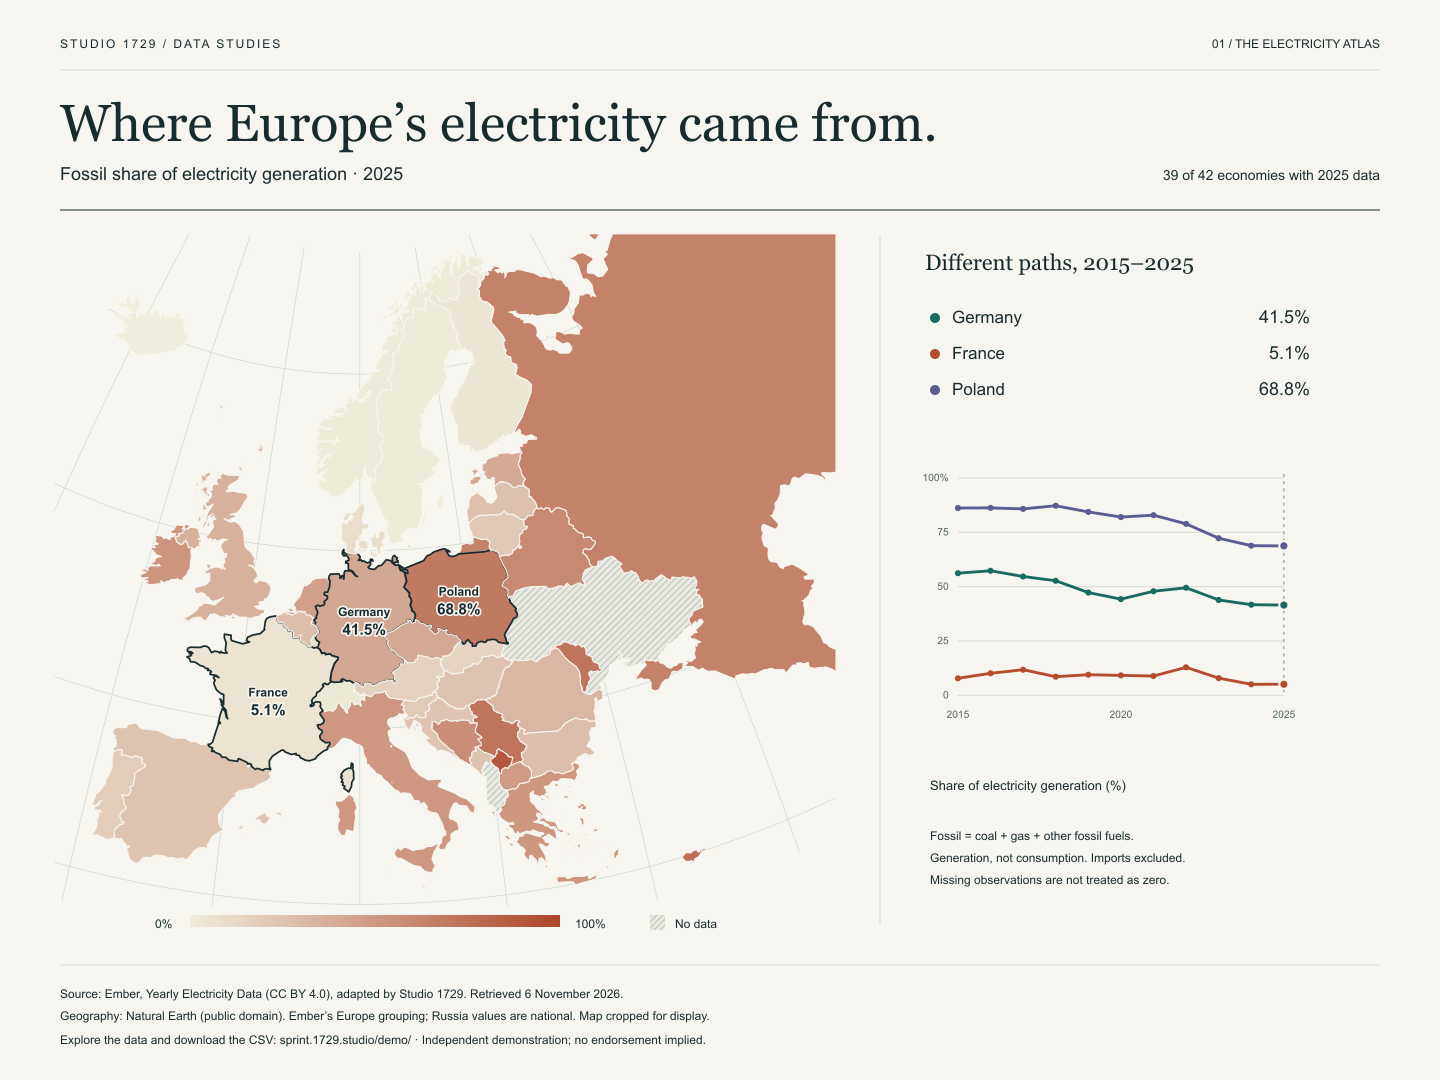
Examples
What you get
One interactive visual
A map or comparison, shaped around one question in your research. Made for phones and larger screens.
Static figures
Three publication images, plus a readable fallback for the interactive piece.
An embed and the source
A standalone version, files for your website, a data transformation script and handover notes.
A checked, documented result
Clear sources, units and missing-data notes. One consolidated review round and 14 days of defect fixes.
How it works
Data in
Send the report, data, deadline and the question you want readers to explore. We agree the scope before the deposit.
One review
I prepare the visual. Your research reviewer checks the findings and sends one consolidated set of changes.
Delivery
You get the interactive piece, static figures and source files in five business days after the inputs and deposit arrive.
The fixed scope covers one language, one geographic level, up to two supplied tables and 10,000 records, two filters, and four hours of data cleaning. New research, live data feeds and larger datasets need a separate scope. Time waiting for data or feedback pauses the five-day schedule. Optional hosting is included for 90 days.
A few questions
Who owns the result?
After final payment, the project-specific work is yours. You get the source files and a continuing licence to any reusable studio code included in them. Third-party data and assets keep their own licences.
What do you need from us?
The report, up to two data tables, source and licence notes, approved wording and a publication date. One person should check the research and one person should approve the design; they can be the same person.
What if our data is messy?
Four hours of cleaning are included. I check a sample before we agree the scope. If it needs more work, we can narrow the visual or agree a separate data-preparation job before starting.
Can it live on our site?
Yes. You receive static files to host yourself and an iframe embed. We check your actual website container. A PNG and data table are included if your CMS cannot run the interactive version. Optional hosting is included for 90 days.
What about VAT and invoices?
The price is $2,500 USD excluding VAT. Billing details and the applicable tax treatment are confirmed before invoicing. Tell me about any purchase order or supplier requirements before we book the slot. Half is paid upfront; the balance is due within seven days of acceptance.
Have a report coming up?
A link and a few sentences are enough to start.