 STUDIO 1729
01 / The electricity atlas
Where Europe’s
electricity came from.
One continent. Different paths.
Explore a decade of electricity generation.
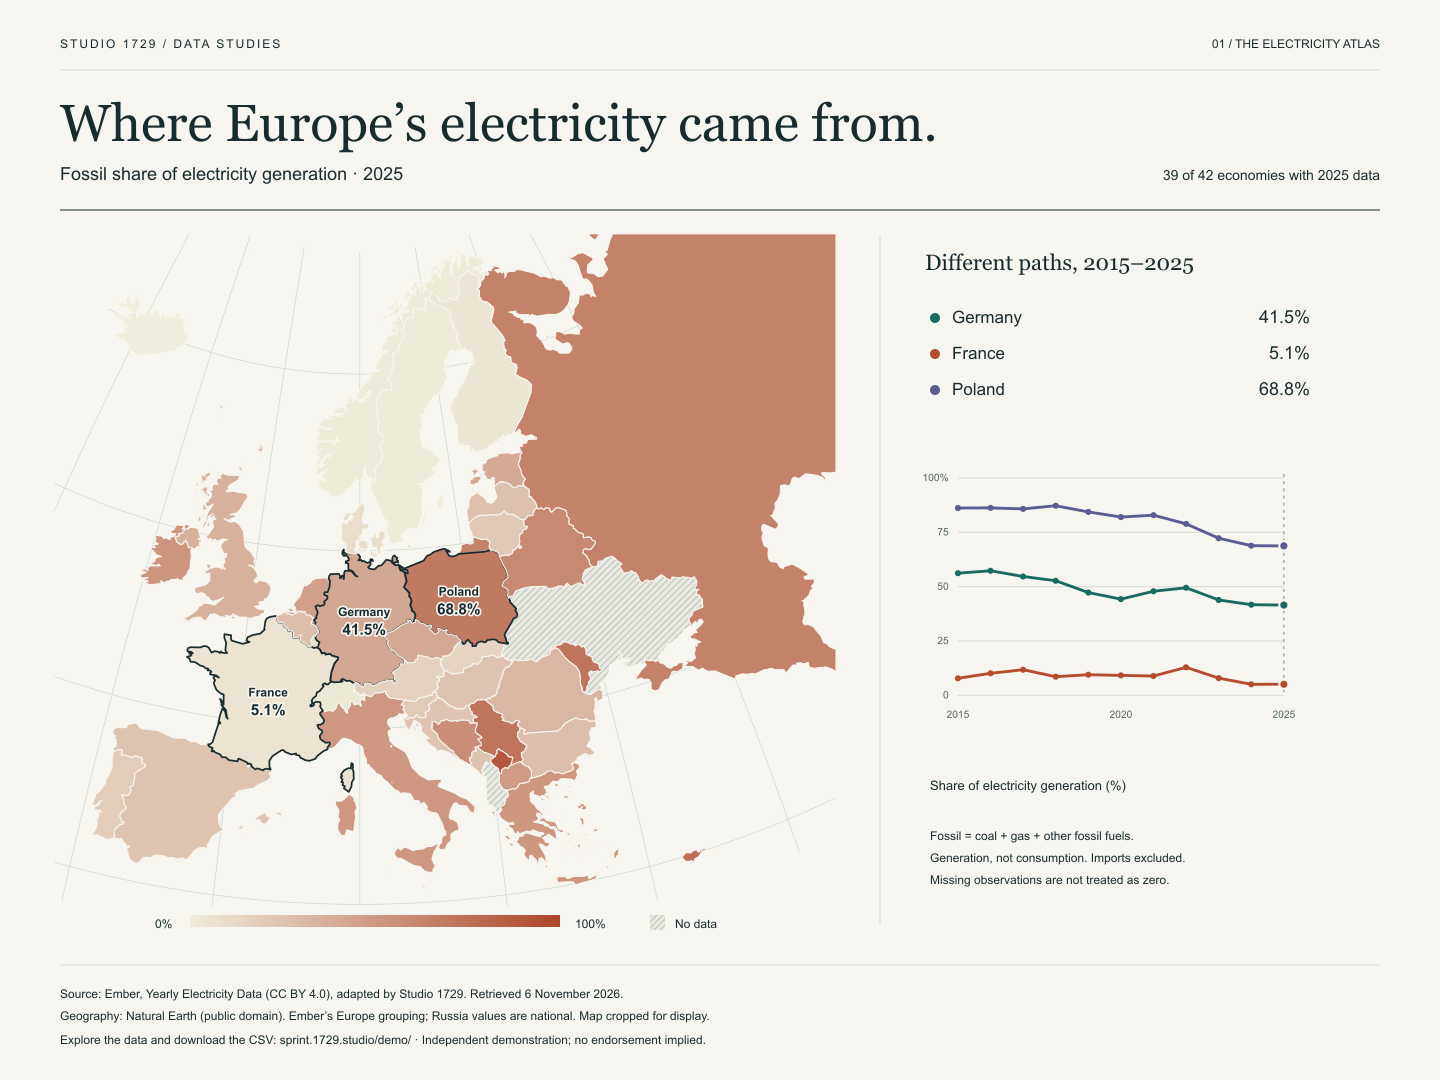
Fossil electricity, 2025
Share of generation (%)Select a country to compare.
Use the figures. Follow the sources.
See the values in a table
The atlas, at a glance
A note on the numbers
This is an independent demonstration, not an Ember publication or a commissioned client project.
Source & licence
Ember, Yearly Electricity Data, adapted under CC BY 4.0. Country shapes: Natural Earth, public domain. Data are filtered to 2015–2025 and Ember’s Europe classification; shapes are simplified for this view. The grouping includes Cyprus and Russia, but not Türkiye. Russia’s values are national although its shape is cropped. No affiliation or endorsement is implied.
How this was checked
All 456 available country-years were checked against generation totals; the largest component-sum difference is 0.002 TWh (rounding). Missing observations stay missing: “No data” is not zero. Albania has no 2025 observation, the Faroe Islands end in 2023, and Ukraine ends in 2022. Fossil includes coal, gas and other fossil fuels; the seven views are not seven additive categories. Read the source and validation record for coverage, definitions and reconciliation tolerances.
Read the map carefully
The same 0–100% scale is used across every year and source. Small economies use the same scale as large ones. A large coloured country does not necessarily produce more electricity. Boundaries are for orientation, not a statement about sovereignty. Some economies have no visible shape at this scale; all remain available in the selector and CSV.
What could readers explore in your report?
About the $2,500 sprint ↗