 STUDIO 1729
02 / The carbon price study
One tonne.
Different prices.
A carbon price is only half the story.
See the rate. Then see what it covers.
Snapshot, not live prices
Headline rates are not effective costs. Exemptions, free allocation and the emissions covered differ. This is a comparison of selected instruments, not a ranking of climate ambition or a CBAM bill.
Loading the carbon price study… The static figure and data table are available below.
Emissions trading systems
Emissions trading Carbon tax Your benchmark
Fixed scales: $0–200 per tonne; coverage 0–100%. Coverage is for the whole instrument, even when a sector is selected. Sector tags do not mean every emitter or product is covered.
One view. Every assumption visible.
Exact values for this view
| Instrument | Type | USD / tCO₂e | Jurisdiction coverage |
|---|
The default view, on paper
Prices need context.
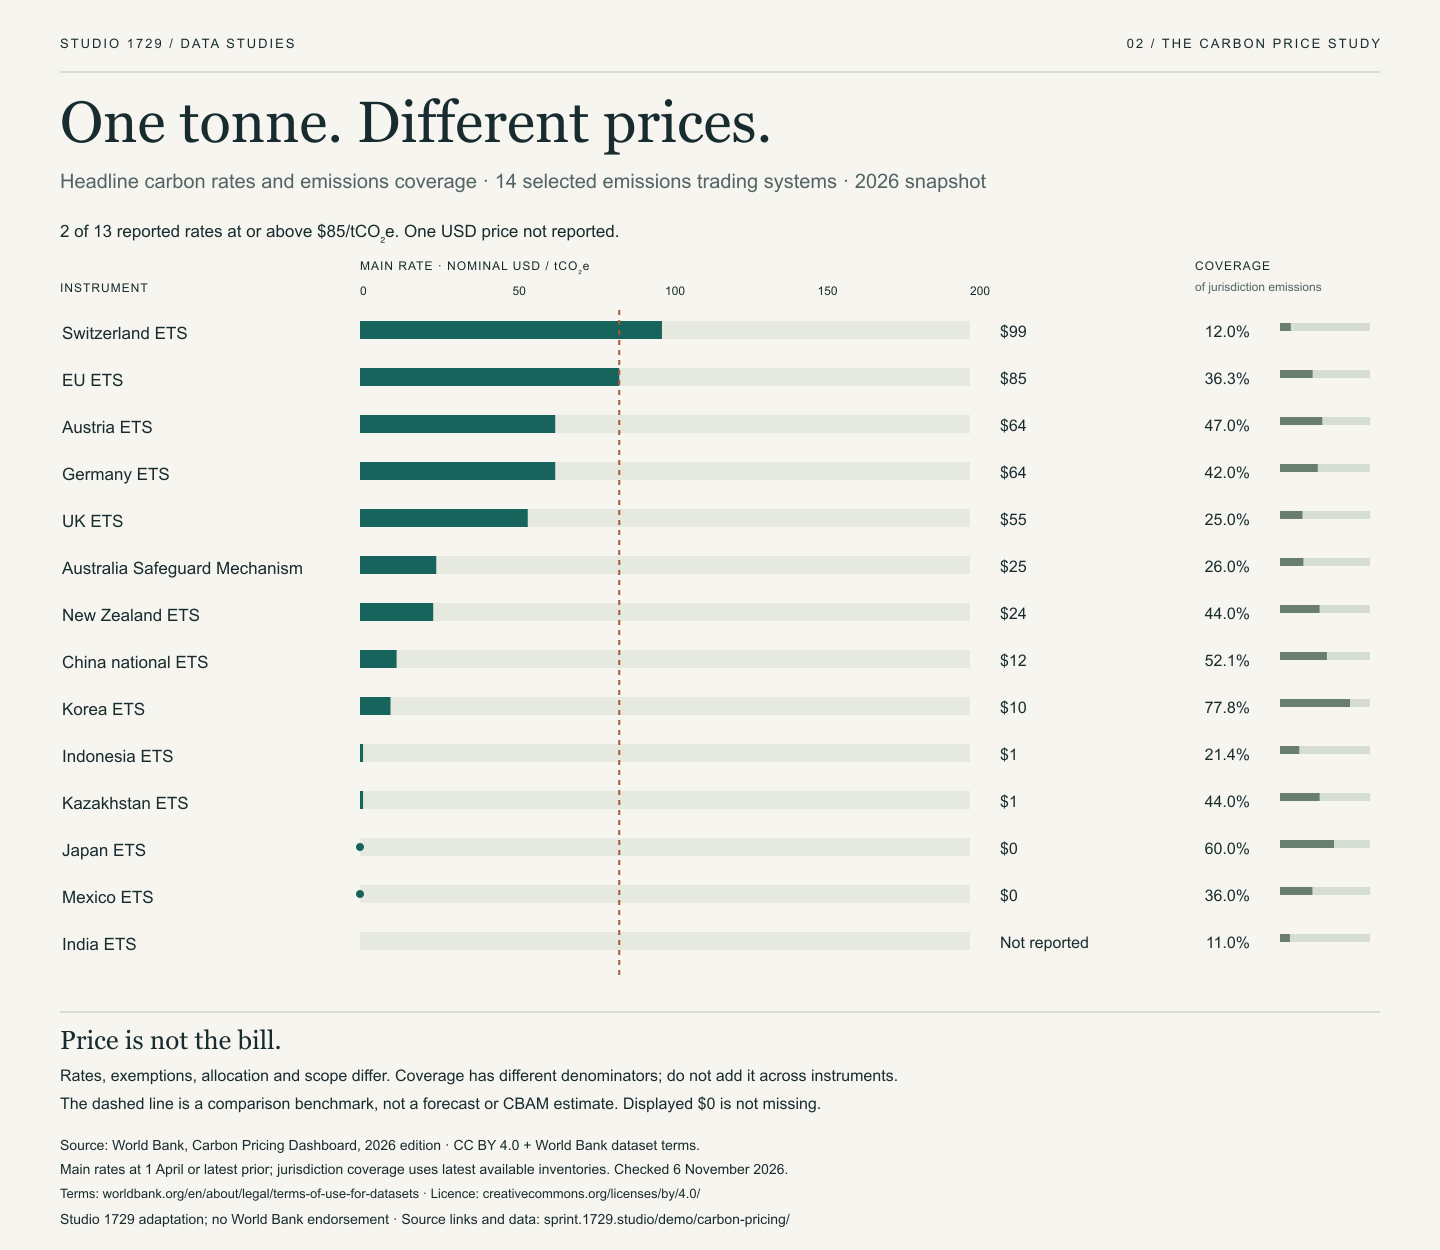
Read all 24 instruments in a table · Download CSV · Open PNG
Behind the comparison
A note on
the numbers.
Independent data study by Studio 1729. No affiliation with the World Bank.
Source & licence
World Bank Carbon Pricing Dashboard, 2026 edition, public instrument table checked 6 November 2026. The dataset catalogue licenses these data under CC BY 4.0, with the World Bank’s additional dataset terms. This adaptation selects 24 instruments, converts coverage fractions to percentages and adds filters. No endorsement is implied.
What is being compared?
Displayed main rates in nominal US dollars per metric tonne of CO₂ equivalent. The publisher’s methodology uses 1 April, or the latest available price beforehand. Rates retain the table’s whole-dollar precision. These are not average payments, current market quotes or comparable measures of policy strength. “ETS” follows the publisher’s classification, including fixed-price and intensity-based systems.
Coverage is not a world total
Each percentage uses that instrument’s jurisdiction as its denominator and the latest available emissions inventory. It is not the share of global emissions, nor the share of emissions in the selected sector. Instruments can overlap; do not add these percentages. Coverage estimates may not reflect every exemption, threshold or free allocation.
How this was checked
All 24 selected rows were checked against the public table. Instrument IDs are unique; the EU ETS is counted once, not again for participating countries. All coverage fractions fall between zero and one. Of 24 instruments, 23 have numeric USD rates: two display $0, and India’s USD field has no number. Missing stays missing. Benchmark counts exclude missing rates and use the source’s displayed precision. The validation record, complete HTML table and CSV preserve the distinction.
Why this is not a CBAM calculator
A country’s headline carbon price is not a deductible carbon payment on a shipment. This study has no product-level emissions, free-allocation adjustments or evidence of payments made. It therefore estimates no border charge. Read the European Commission’s CBAM guidance for that separate question.
What could readers explore in your report?
About the $2,500 sprint ↗