Data notes / 02 · Electricity · 2015–2025
A large fall in fossil share can still leave a fossil-heavy grid.
Ten years of change and the latest electricity mix answer different questions. Six European cases show why a progress ranking needs an endpoint.
Studio 1729 · · Sources retrieved 6 November 2026
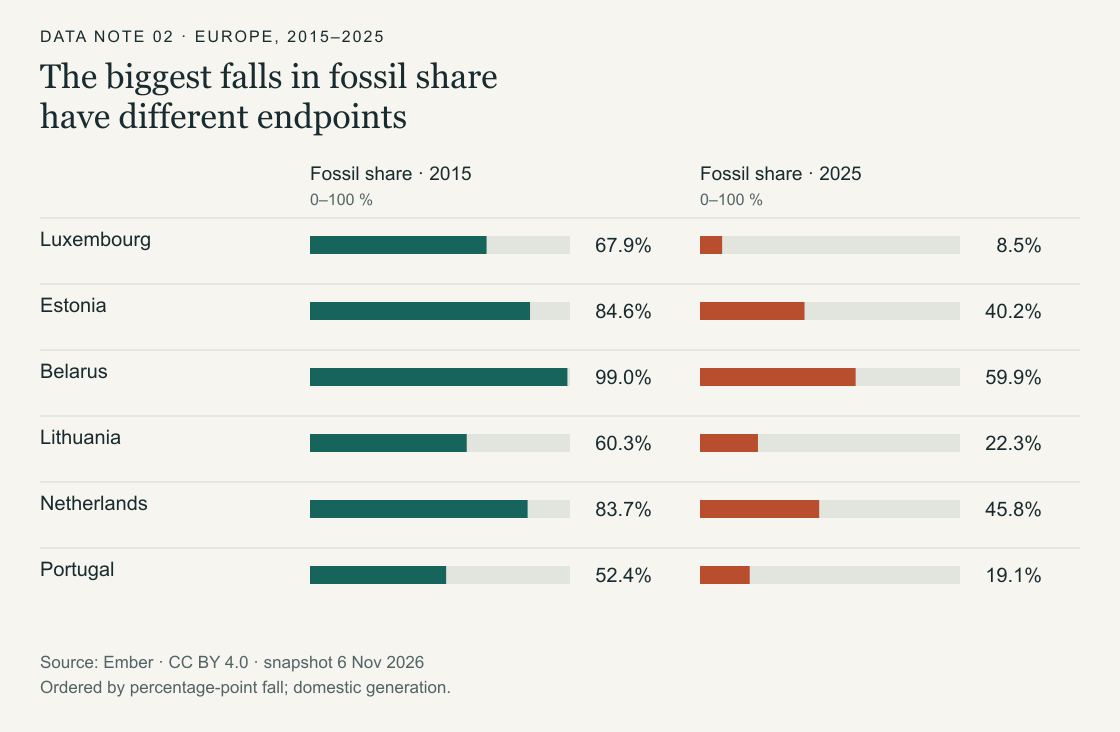
Among 39 European countries with data for both years, Luxembourg recorded the largest fall in fossil electricity share between 2015 and 2025: 59.4 percentage points. Estonia followed with a 44.4-point fall. Yet their 2025 fossil shares were very different: 8.5% in Luxembourg and 40.2% in Estonia. Ranking the change alone hides the endpoint.
The figure pairs the starting and ending shares for the six largest percentage-point declines in the sample. It is a comparison of domestic electricity generation, with fossil defined as coal, gas and other fossil fuels. It does not measure total energy use or emissions. Both columns use the same zero-to-100% scale so that the two years can be read directly against one another.

Read the data table · 39 rows
| Country | Code | 2015 fossil (%) | 2025 fossil (%) | Fall (pp) | 2015 fossil (TWh) | 2025 fossil (TWh) |
|---|---|---|---|---|---|---|
| Luxembourg | LUX | 67.91 | 8.516 | 59.394 | 0.91 | 0.136 |
| Estonia | EST | 84.631 | 40.201 | 44.43 | 8.59 | 2.468 |
| Belarus | BLR | 99.003 | 59.864 | 39.139 | 33.75 | 27.196 |
| Lithuania | LTU | 60.284 | 22.292 | 37.992 | 2.55 | 1.972 |
| Netherlands | NLD | 83.696 | 45.846 | 37.85 | 91.22 | 61.909 |
| Portugal | PRT | 52.366 | 19.118 | 33.248 | 26.78 | 9.773 |
| Denmark | DNK | 34.225 | 8.845 | 25.38 | 9.85 | 3.15 |
| Montenegro | MNE | 50.333 | 25.433 | 24.9 | 1.51 | 0.618 |
| Moldova | MDA | 95.53 | 71.559 | 23.971 | 5.77 | 2.087 |
| Latvia | LVA | 49.819 | 26.496 | 23.323 | 2.76 | 1.65 |
| Bulgaria | BGR | 50.462 | 28.118 | 22.344 | 24.58 | 10.705 |
| Spain | ESP | 44.337 | 25.389 | 18.948 | 122.89 | 73.199 |
| Ireland | IRL | 71.687 | 52.799 | 18.888 | 20.18 | 16.685 |
| United Kingdom | GBR | 54.643 | 35.788 | 18.855 | 185.17 | 105.094 |
| Greece | GRC | 70.911 | 52.213 | 18.698 | 36.2 | 30.246 |
| Finland | FIN | 21.615 | 3.803 | 17.812 | 14.83 | 3.137 |
| Poland | POL | 86.19 | 68.777 | 17.413 | 141.61 | 118.812 |
| Cyprus | CYP | 91.189 | 74.934 | 16.255 | 4.14 | 4.327 |
| Czechia | CZE | 56.055 | 40.779 | 15.276 | 46.24 | 30.799 |
| North Macedonia | MKD | 64.071 | 49.226 | 14.845 | 3.62 | 3.502 |
| Germany | DEU | 56.204 | 41.539 | 14.665 | 359.24 | 206.465 |
| Belgium | BEL | 40.757 | 27.929 | 12.828 | 27.89 | 20.131 |
| Hungary | HUN | 37.191 | 24.633 | 12.558 | 11.28 | 9.884 |
| Slovenia | SVN | 32.432 | 21.121 | 11.311 | 4.8 | 3.137 |
| Romania | ROU | 42.385 | 32.314 | 10.071 | 27.83 | 16.09 |
| Italy | ITA | 61.069 | 51.313 | 9.756 | 170.81 | 136.081 |
| Bosnia Herzegovina | BIH | 66.22 | 56.676 | 9.544 | 10.88 | 8.238 |
| Croatia | HRV | 33.096 | 23.675 | 9.421 | 3.72 | 3.486 |
| Malta | MLT | 92.308 | 83.492 | 8.816 | 1.2 | 1.86 |
| Kosovo | XKX | 97.709 | 89.451 | 8.258 | 5.97 | 5.245 |
| Austria | AUT | 22.969 | 16.351 | 6.618 | 14.19 | 11.975 |
| Slovakia | SVK | 20.361 | 14.895 | 5.466 | 5.42 | 4.332 |
| France | FRA | 7.817 | 5.107 | 2.71 | 44.88 | 29.333 |
| Russia | RUS | 65.863 | 64.318 | 1.545 | 703.115 | 768.232 |
| Serbia | SRB | 73.105 | 71.722 | 1.383 | 27.48 | 25.984 |
| Norway | NOR | 2.049 | 1.005 | 1.044 | 2.93 | 1.616 |
| Sweden | SWE | 1.944 | 1.228 | 0.716 | 3.15 | 2.091 |
| Switzerland | CHE | 2.815 | 2.312 | 0.503 | 1.86 | 1.503 |
| Iceland | ISL | 0.0 | 0.0 | 0.0 | 0.0 | 0.0 |
Large declines, different remaining shares
Belarus moved from 99.0% fossil generation in 2015 to 59.9% in 2025, a decline of 39.1 percentage points. Lithuania moved from 60.3% to 22.3%, a decline of 38.0 points. The falls are similar in size, but the remaining fossil shares are separated by roughly 38 points. An ordered list of reductions would place these countries close together without showing that difference.
The Netherlands recorded a 37.9-point fall, from 83.7% to 45.8%. Portugal recorded a smaller 33.2-point fall, from 52.4% to 19.1%. On the change measure, the Netherlands ranks ahead of Portugal. On the final fossil share, Portugal has the lower value. Neither ordering is an error: one describes movement from a starting position, while the other describes the generation mix at the end.
This distinction also limits what can be inferred about countries already starting with low fossil shares. They have less room for a large percentage-point decline. A small change can coexist with a consistently low fossil share. Conversely, a large improvement from a very high starting point can leave fossil fuels supplying a substantial fraction of domestic generation.
Percentage points are not percentage changes
For each country, the reported fall is its 2015 fossil share minus its 2025 fossil share. Luxembourg’s calculation is 67.910 minus 8.516, giving 59.394 percentage points before rounding. That is not a 59.394% reduction in fossil output. It is a subtraction of two percentages with different annual generation denominators.
A relative change in the share would divide that difference by the starting share. A change in fossil generation itself requires the TWh values. Keeping those three calculations separate avoids describing a change in the electricity mix as if it were a physical quantity of fuel or electricity saved. The downloadable table includes both endpoint shares and fossil generation volumes so the distinction can be checked.
The denominator can move too
Lithuania’s total generation increased from 4.230 TWh in 2015 to 8.846 TWh in 2025. Fossil generation declined from 2.550 to 1.972 TWh. The fossil share therefore fell much more sharply than the fossil volume: the numerator became smaller while the denominator became larger. Reading the share alone would not reveal those two movements.
Estonia illustrates a different combination. Total generation declined from 10.150 to 6.139 TWh, while fossil generation declined from 8.590 to 2.468 TWh. Its fossil share fell even though the total generation denominator also shrank. These arithmetic comparisons describe the data; they do not identify the policies, technologies, weather conditions or trading patterns responsible for the changes.
What this comparison can establish
Domestic generation excludes imported electricity. A falling domestic fossil share is therefore not automatically the same as a falling fossil share of consumption. Nor is fossil share an emissions-intensity measure: different fossil fuels and generating technologies can produce different emissions per unit of electricity. This note makes no conversion from generation shares to tonnes of carbon dioxide.
The observations come from Ember’s Yearly Electricity Data, retrieved on 6 November 2026, under CC BY 4.0. Selection and calculations are by Studio 1729. Europe follows Ember’s grouping, including Cyprus and Russia and excluding Türkiye. Albania, the Faroe Islands and Ukraine have no 2025 observation in this snapshot and are excluded from the matched comparison; missing years are not filled.
The six countries in the figure are selected by the largest unrounded percentage-point falls. The CSV includes all 39 matched countries. Endpoint comparisons do not show the path between them: a decade-long fall can include temporary rises. For the intervening annual observations, use the electricity explorer. Values may be revised by the publisher.
Made by Studio 1729. We build pieces like this for reports: sprint.1729.studio.