Data notes / 03 · Carbon pricing · 2026
Two carbon prices do not make one combined rate.
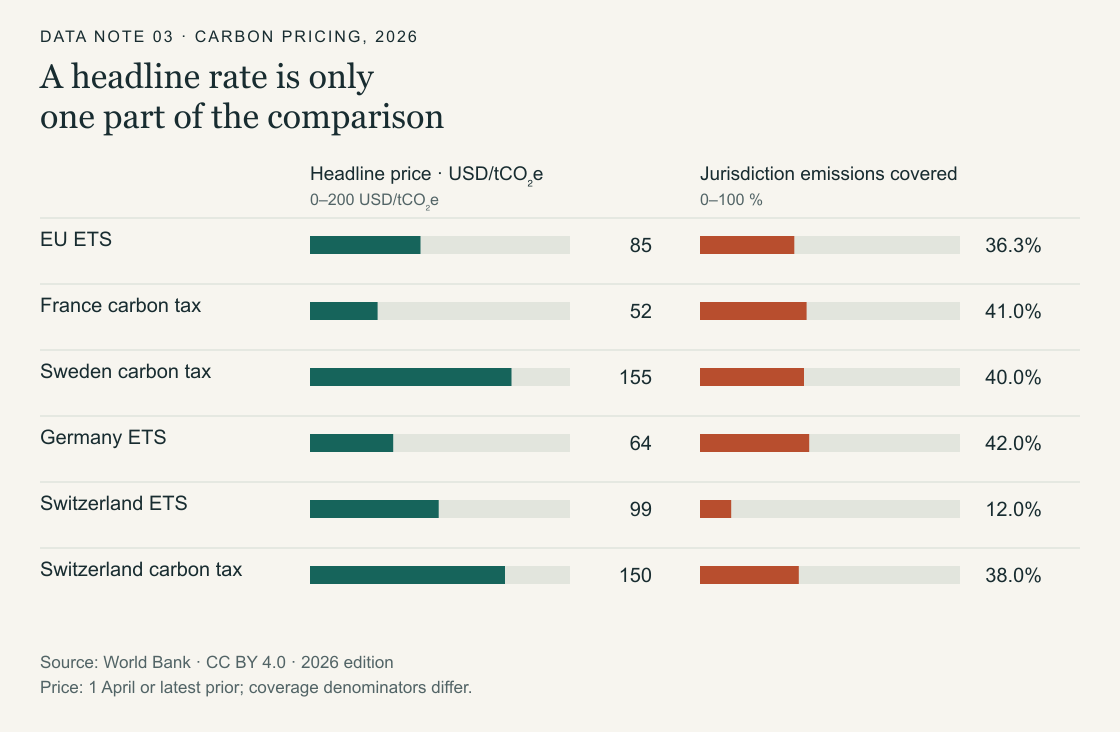
A 2026 snapshot of European carbon pricing puts the headline price beside its coverage. Neither column tells you which instruments apply to the same tonne.
Studio 1729 · · Sources retrieved 6 November 2026
The World Bank’s 2026 dashboard snapshot displays an EU Emissions Trading System price of US$85 per tonne of CO₂ equivalent and a French carbon-tax rate of US$52. Adding them produces US$137 arithmetically, but the table does not establish a combined French carbon price of US$137. It does not tell us that both rates apply to the same emissions.
A carbon-price comparison needs at least two separate questions: what price does an instrument display, and which emissions does it cover? A third question concerns how instruments interact for a particular activity. This note keeps the first two visible and explains why the available headline fields cannot answer the third. The figure is an illustrative selection, not a ranking of every European instrument.

Read the data table · 6 rows
| Instrument | Jurisdiction | USD/tCO₂e | Jurisdiction coverage (%) |
|---|---|---|---|
| EU ETS | EU27+ | 85 | 36.2704721 |
| France carbon tax | France | 52 | 41.0 |
| Sweden carbon tax | Sweden | 155 | 40.0 |
| Germany ETS | Germany | 64 | 42.0 |
| Switzerland ETS | Switzerland | 99 | 12.0 |
| Switzerland carbon tax | Switzerland | 150 | 38.0 |
Put coverage beside the price
The selected data show Sweden’s carbon tax at US$155, with coverage of 40.0% of its jurisdiction’s emissions. France’s tax is US$52, with 41.0% coverage. The EU ETS is US$85, with 36.3% coverage of its own jurisdiction. These rows describe instruments with different geographical and policy boundaries. Their percentages do not refer to a common pool of emissions.
Switzerland offers a compact illustration within one country. Its ETS is shown at US$99 with 12.0% coverage, while its carbon tax is US$150 with 38.0% coverage. The higher tax rate does not mean the entire Swiss economy faces that rate. Nor do the two coverage figures by themselves identify the emissions, if any, that overlap. A combined coverage calculation requires that information.
Why adding the rates needs more evidence
Imagine two instruments covering entirely separate activities. Their listed rates would describe different tonnes, so adding the rates would not describe the payment on either tonne. Now imagine that some activities fall within both instruments. A combined rate would still require knowing the applicable treatment for those activities, including any relief or adjustment. These are alternative examples, not claims about the operation of a particular national system.
The same issue appears when adding coverage. If two policies covered 20% and 30% of the same jurisdiction’s emissions, their combined reach could only be calculated after accounting for overlap. With different jurisdictions, there is an additional denominator problem: the percentages cannot be added even before overlap is considered. The EU ETS coverage figure is not a national French coverage estimate.
A dated headline is not an effective cost
The World Bank’s price comparison uses prices on 1 April, or the latest available observation before that date. This note retains the 2026 edition’s displayed nominal US-dollar values. It is not a live allowance-price feed or a forecast. Where an instrument has several rates, the headline field represents the main rate rather than a complete schedule.
The source classifies Germany’s national instrument as an ETS and displays US$64 in this snapshot. The local source notes identify a fixed price for that observation. This is another reason to keep the instrument label separate from assumptions about how its reported price was formed. An ETS label alone does not turn a dated value into a current market quote.
Multiplying a headline price by the coverage fraction also does not establish the average price actually paid across an economy. That calculation would need an appropriate emissions base and information about payments and treatment within the covered population. The dashboard’s methodology explains that coverage estimates do not necessarily incorporate every exemption, threshold or free allocation. Coverage is useful context, but is not a payment ledger.
Scope, source and reuse
The six figure rows come from the World Bank Carbon Pricing Dashboard, 2026 edition, retrieved on 6 November 2026. They are selected to illustrate different prices and coverage, including two instruments in Switzerland. The downloadable CSV preserves the selected displayed prices and coverage precision; chart labels round coverage to one decimal place. The regional EU ETS appears once, rather than being repeated as a separate instrument for each participating country.
The dataset is licensed CC BY 4.0, with the World Bank’s additional dataset terms. Selection and presentation are by Studio 1729; no World Bank endorsement is implied. The carbon-pricing explorer provides a larger selected sample. These tables support a comparison of reported instruments, not a calculation of a particular company’s liability or a country-wide effective carbon price.
Made by Studio 1729. We build pieces like this for reports: sprint.1729.studio.